In this article, we'll show you how to build an OEE solution inside the Tulip platform by (mostly) using the templates already available in the Tulip Library.
Instructions
Here's how to set up your OEE solution with Tulip:
Tulip Machine Monitoring Config
Go to the Machine Monitoring Configuration via the Shop floor → Machines menu item.
Tulip Machine Monitoring Navigation
Create a new Machine Type for the machine, line, or device that you would like to monitor.
Tulip Machine Type Interface
Start adding Machine Attributes to match with the specific properties of your machine or line.
Tulip Machine Type Interface - Adding Machine Attributes
You can reuse existing machine attributes from other machine types, or create new machine attributes for attributes that haven't been created already.
Create a new Machine Trigger to automatically recognise the machine state based on a running bit.
Tulip Machine Type Interface - Creating Machine Triggers
Start with a basic machine trigger like automatic state recognition, and then extend to more machine triggers for use cases like automatic downtime or waste assignment.
Create a new Data Source to connect Tulip with your local assets, using for example a KepserverEX and the OPC UA protocol to communicate machine attributes.
Tulip Machine Monitoring - Creating Data Sources
For this demo, we used a trial version of KepserverEX and set it up on an Azure virtual machine. Afterwards, we configured the network settings to allow OPC UA communication using anonymous authentication on port 49320. Finally, we created a ‘CT-MACHINE-1’ simulation example and added some simulation tags.
KepserverEX Simulation Example
6. Create a new Machine using the Machine Type we’ve just added.
Tulip Machine Monitoring - Creating Machines
Start mapping your Machine Attributes with properties inside the KepserverEX we’ve just added.
Add the 9 Production Management apps included in the App Suite by clicking “+ Add 9 Apps”, entering your Tulip Account URL, and clicking the Install button using an admin account.
Go to the App Configuration via the Apps → Apps menu item.
Tulip Apps Navigation
Navigate to the Apps / Tulip Library / Production Management folder, duplicate and rename the Machine Monitoring Terminal app.
Duplicate Machine Monitoring Terminal app
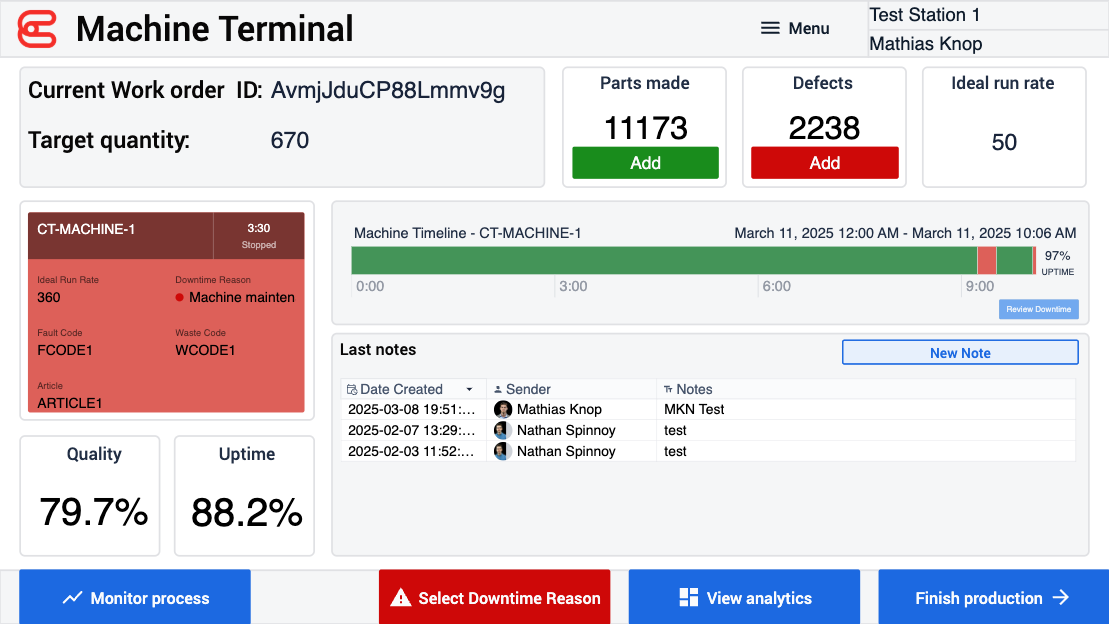
Open the app, set your own Base layout, remove the help text, and put the Read me step last.
Machine Monitoring App - Developer Interface
Analytics
Update all the Analytic metrics on all steps to include the right Machine Type.
Configuration of Quality metric
Hybrid Downtime Justification
As mentioned earlier, we are going to create a Machine Trigger for automatic downtime assignation. The logic is quite straightforward: we are triggering on state changes, and the conditions are there to check the machine Fault Code attribute, and to make sure the Running Bit is not true.
Auto-assign Downtime Trigger
We replicate as many Else If cases as we have Fault Codes, and that’s it.
Additionally, we set up a final Else If case with just one condition on the Running Bit to store a newly created “TO BE JUSTIFIED” downtime reason.
Auto-assign Downtime Trigger - TO BE JUSTIFIED
Finally, we are updating the Step Trigger logic on the Machine Terminal Monitoring step. We'll include the condition that we only navigate to the step for manual downtime justification in case our current downtime reason is equal to “TO BE JUSTIFIED”.
Reconfigure the downtime reasons (or the trigger actions) of your machine type if you want to use the template Select Downtime Reason page as it is, because the downtime reasons included in the current trigger actions behind the buttons are no default downtime reasons.
We value your privacy! We use cookies to enhance your browsing experience and analyse our traffic. By clicking "Accept All", you consent to our use of cookies.